The NIKA2 SZ Large Program
High-resolution SZ observations of a large sample of clusters of galaxies
Public Release of NIKA SZ Data
This webpage aims at describing the content of the released data products associated with this project. Note that, while NIKA was a dual-band instrument observing simultaneously at 150 and 260 GHz, only the 150 GHz data are released for the time being.
The NIKA SZ are publicly released on 2017 Nov 20th.
Citations
If you use the NIKA released data in a publication or in a conference, please consider citing at least
- the paper corresponding to the cluster
- the paper on Performance and calibration of the NIKA camera
Data
The data are freely availableYou may get
- the full dataset (6 clusters). Please click here
- data fo each cluster of the NIKA SZ sample
| Cluster | z | R.A. | DEC. | Image | Comments | Data | Main Reference |
| RX J1347.5-1145 | 0.452 | 13.0,47.0,30.575 | -11.0,45.0,10.08 | 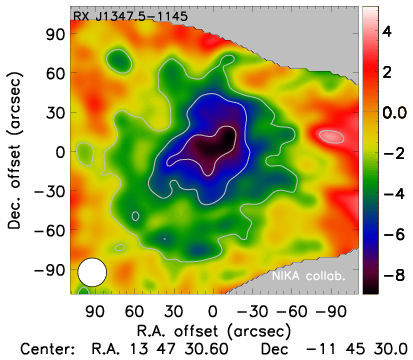 |
Map, point source model, no transfer function and noise realization for this cluster Note that for this cluster, beam and bandpasses are different |
file |
R. Adam et al.,
Astron. and Astrophys. 569 (2014) A66, arXiv:1310.6237 |
| MACS J1423.8+2404 | 0.545 | 14.0,23.0,47.908 | +24.0,04.0,42.6 | 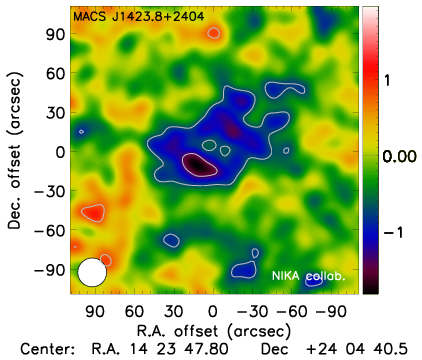 |
Map, noise realization, point source model, transfer function, beam and bandpass |
file |
R. Adam et al.,
Astron. and Astrophys. 586 (2016) A122 arXiv:1510.06674 |
| MACS J0717.5+3745 | 0.546 | 07.0,17.0,31.740 | +37.0,45.0,30.73 | 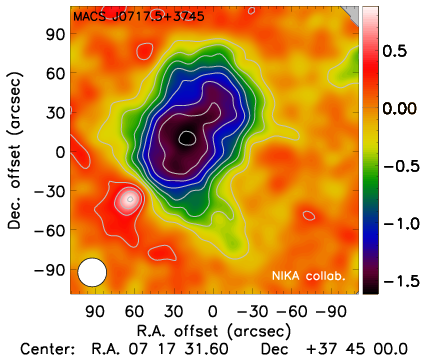 |
Map, kSZ-model-substracted map, noise realization, point source model, transfer function, beam and bandpass |
file |
R. Adam et al.,
Astron. and Astrophys. 598 (2017) A115 arXiv:1606.07721 R. Adam et al., Astron. and Astrophys. 606 (2017) A64 arXiv:1706.10230 |
| PSZ1 G046.13+30.75 | 0.569 | 17.0,17.0,05.780 | +24.0,04.0,26.00 | 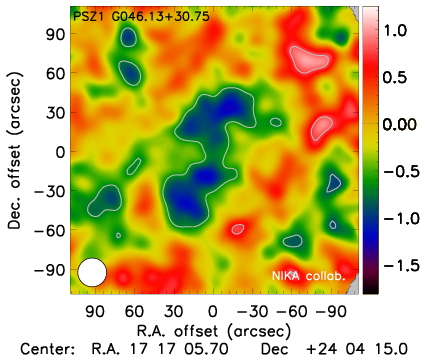 |
Map, noise realization, point source model, transfer function, beam and bandpass |
file | - |
| PSZ1 G045.85+57.71 | 0.611 | 15.0,18.0,20.811 | +29.0,27.0,39.10 | 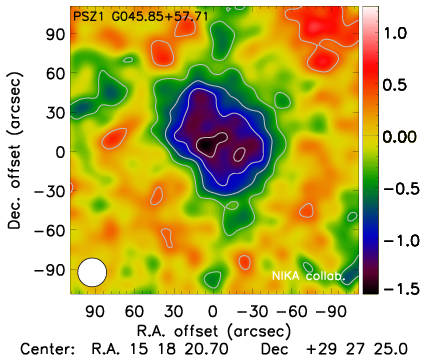 |
map, noise realization, point source model, transfer function, beam and bandpass |
file |
F. Ruppin et al.,
Astron. and Astrophys. 597 (2017) A110 arXiv:1607.07679 |
| CL J1226.9+3332 | 0.888 | 12.0,26.0,58.454 | +33.0,32.0,48.36 | 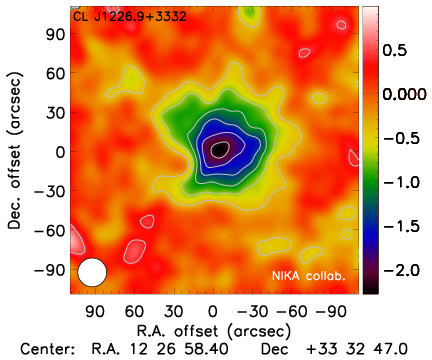 |
map, noise realization, point source model, transfer function, beam and bandpass |
file |
R. Adam et al.,
Astron. and Astrophys. 576 (2015) A12 arXiv:1410.2808 C. Romero et al., arXiv:1707.06113 |
Explanatory supplement
150 GHz Maps
The NIKA maps are computed from raw time ordered data using the NIKA processing pipeline. See
Catalano et al (2014), Adam et al (2015)
and Adam et al (2014) for the main steps of the data
reduction. The maps are given in units of surface brightness (mJy/beam). The data are projected on
151x151 pixels grids, where the size of the pixels are 2x2 arcsec. Images include standard
astrometric metadata in the header.
Best-fit Point Source Model
The NIKA cluster fields contain non negligible radio and sub-millimeter sources identified either
from NIKA data themselves, from the literature, or from Herschel data. For each cluster, we provide
a point source model extracted from jointly fitting NIKA with higher (Herschel) and lower
(literature) frequency data. See Adam et al (2016)
for the procedure. We stress that the flux of each
source in the correction maps are not necessarily well constrained, depending on the available
external dataset. In addition, it depends on the underlying model that we assume for the SED of
each object (either grey body or power law for infrared and radio sources, respectively). Therefore,
we recommend to use this model only to quantify the impact of contaminant galaxies, but not to
take it as the true contaminant signal.
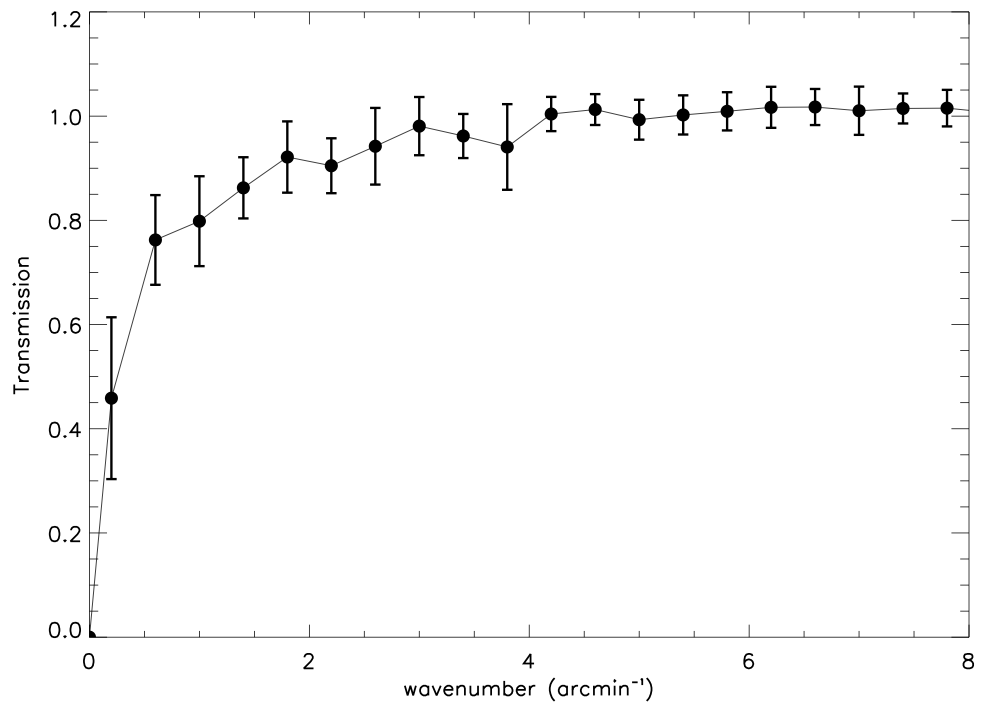
Transfer function
Because of the scanning strategy and the necessary processing to subtract the correlated noise from
the time ordered data, the NIKA maps are affected by filtering. This is true in particular for scales
beyond the size of the field of view (~2 arcmin).
The amount of filtering is estimated as described in Adam et al (2015). In brief, we compare the
power spectrum of the map of simulated data before and after processing them through the NIKA
pipeline. We provide the azimuthally averaged transfer function, as a function of wave number, for
each cluster. We note that NIKA data are not sensitive to the zero level surface brightness of the sky.
Therefore, the transfer function at wavenumber k=0 is equal to 0. The error bars provide the
dispersion of the transfer function measured on individual scans, and thus, are sensitive to variation
of atmospheric conditions during the data acquisition. See figure below for an example of the
transfer function.
We also provide the following IDL script to be used in order to apply the transfer function to non
filtered data, to account for the effects of the reduction. This is to make sure that the definition of the
angular frequency, k, is the same when computing and applying the transfer function onto maps.
The raw NIKA maps can also be deconvolved in a similar way but the noise (in particular on the
edge of the map) will drastically increase.
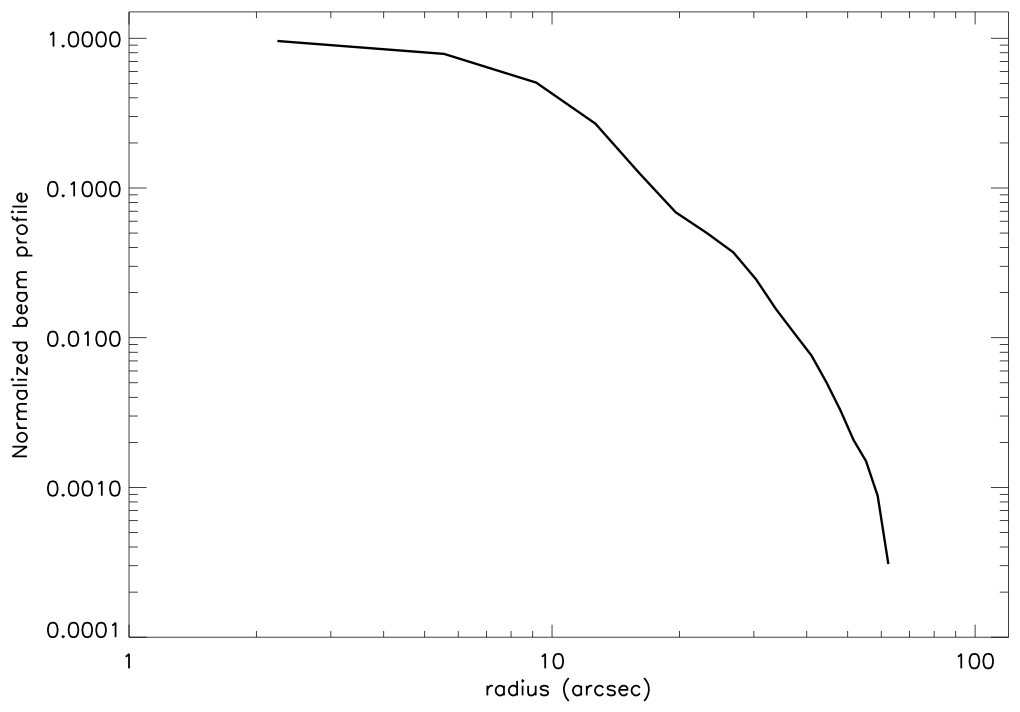
Beam
The beam profile corresponds to the surface brightness profile of Uranus, normalized by the
amplitude of the gaussian best fit of the corresponding map (see figure below). The angular size of
Uranus is typically about 3.5 arcsec, and it is neglected as it broadens the main beam by only about
0.7%.
 |
 |
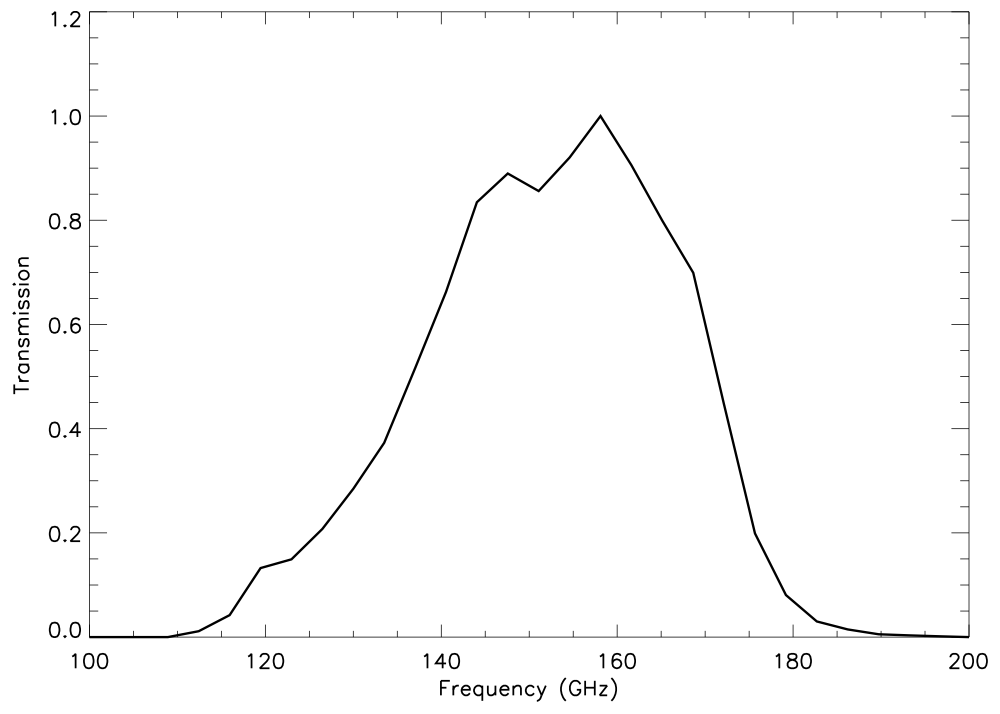 |
| NIKA Transfer function | NIKA Beam | NIKA Bandpass |
Bandpass and Unit conversion
We provide the NIKA transmission as a function of frequency, obtained in the case of diffuse
emission. See Figure above
The following tables provide the conversion from Jy/beam to Compton parameter for different gas
temperature (see Adam et al (2017) for more details).
| T |
I |
I |
I |
I |
| 1 | 3.76 | -11.63 | 7.47 | 12.40 |
| 5 | 3.31 | -11.34 | 7.30 | 12.03 |
| 10 | 2.83 | -11.00 | 7.11 | 11.62 |
| 15 | 2.43 | -10.71 | 6.94 | 11.24 |
| 20 | 2.06 | -10.38 | 6.81 | 10.9 |
| 25 | 1.76 | -10.17 | 6.75 | 10.58 |
We also provide color correction for typical SED, both for extended emission and point sources. The assumed spectra follow f(ν) ∝ να
| α | Point source, pwv=2 mm, 150 GHz |
Point source, pwv=5 mm, 150 GHz |
Diffuse source, pwv=2 mm, 150 GHz |
Diffuse source, pwv=2 mm, 150 GHz |
Point source, pwv=2 mm, 260 GHz |
Point source, pwv=5 mm, 260 GHz |
Diffuse source, pwv=2 mm, 260 GHz |
Diffuse source, pwv=2 mm, 260 GHz |
| -3 | 0.94 | 0.92 | 0.99 | 0.97 | 0.80 | 0.78 | 0.85 | 0.83 |
| -2 | 0.97 | 0.95 | 1.00 | 0.98 | 0.85 | 0.84 | 0.89 | 0.88 |
| -1 | 0.99 | 0.98 | 1.00 | 0.99 | 0.90 | 0.89 | 0.92 | 0.91 |
| 0 | 1.00 | 0.99 | 1.00 | 0.99 | 0.95 | 0.94 | 0.95 | 0.94 |
| 1 | 1.00 | 1.00 | 0.99 | 0.98 | 0.98 | 0.98 | 0.96 | 0.96 |
| 2 | 1.00 | 1.00 | 0.97 | 0.97 | 1.01 | 1.01 | 0.97 | 0.98 |
| 3 | 0.98 | 0.99 | 0.94 | 0.95 | 1.03 | 1.04 | 0.98 | 0.98 |
| 4 | 0.96 | 0.98 | 0.91 | 0.92 | 1.04 | 1.05 | 0.97 | 0.98 |
Noise
For each cluster, we provide a set of 100 noise realizations obtained as described in
Adam et al (2016). They include correlated noise as modeled from half difference maps (Jack-Knife), as well as
inhomogeneities of the noise due to the scanning strategy. The noise realizations also include the
expected contribution from the CIB modeled as described in Adam et al (2017). The latter is largely
subdominant for most of the data at 150 GHz, except for the deepest observations of MACS
J0717.5+3745 where it becomes significant. The noise contained in the NIKA maps is well
described by a gaussian noise, but we stress that it is correlated across pixels of the maps.
Therefore, averaging the values of nearby pixels (e.g. when smoothing) does not reduce the noise
by sqrt(N).
Special case of RX J1347.5-1145
The NIKA data provided in this page have been obtained with the final NIKA setup, and are
homogeneous, except in the case of the cluster RX J1347.5-1145. For this cluster, the detectors, the
optics, the bandpasses and the beam were significantly different (see Adam et al (2014)). In addition,
the scanning strategy was not optimal due to a mistake in the telescope control system. Therefore,
the full characterization of the data was not done for RX J1347.5-1145 and we only provide the raw
map in the case of this cluster. We highly encourage to use the data only in a qualitative way (e.g.,
overlapping contours).
Special case of MACS J0717.5+3745
The cluster MACS J0717.5+3745 is known to host a significant amount of kinetic SZ signal
(Mroczkowski et al. 2012, Sayers et al. 2013, Adam et al (2017)). Therefore, we also provide a map
corrected from the best fit kSZ model obtained in Adam et al (2017). However, we stress that this
models remains poorly constrained and is affected by large degeneracies between the cluster gas
line-of-sight velocity and the optical depth. Therefore, in the context of thermal SZ studies, we
encourage to use the kSZ corrected map to test the stability of any results, with respect to the kSZ
contamination, but not to take the kSZ corrected map as the truth.
pdf version of the explanatory supplement.
Last update 5/10/2023
|
|
|