The NIKA2 SZ Large Program
The NIKA2 SZ Large Program was conceived to exploit the unique capabilities of the NIKA2 camera to obtain high-resolution tSZ observations of a representative sample of galaxy clusters at intermediate and high redshifts (0.5 < z < 0.9).
The LPSZ offers the first SZ-selected sample in this regime with sufficient angular resolution to study the ICM in great detail and thereby to enhance our understanding of galaxy clusters. More precisely, we aimed at understanding the physical processes driving the evolution of massive halos in the Universe and quantify how their thermal content and spatial distribution evolve as they grow through accretion and mergers. In turn, the goal was to obtain a more precise characterization of the SZ–mass scaling relation and its possible redshift dependence within a regime critical for high-precision, cluster-based cosmological analyses
The scientific drivers have been built upon a synergy between SZ data from NIKA2 and X-ray data from XMM-Newton satellite, which share the same high-resolution characteristics. Indeed, the combination of tSZ and X-ray data provides a powerful means of probing the intracluster medium (ICM) thermodynamics and of quantifying how its thermal content and spatial distribution evolve as clusters grow through accretion and mergers.
The LPSZ data have first been used to study individual clusters, which have demonstrated the full scientific potential of the SZ Large Program.
In Ruppin et al. 2018, we presented the first SZ mapping of a galaxy cluster belonging to the NIKA2 SZ Large Program sample. We showed that PSZ2 G144.83+25.11 exhibits an overpressure region that affects both the pressure profile and the constraints on the integrated Compton parameter. In Kéruzoré et al. 2020, we published the data for the most challenging cluster in the sample, characterized by low mass, high redshift, and strong contamination from point sources. In Muñoz Echeverría et al. 2023, we investigated the impact of systematic effects on mass reconstruction in the case of the galaxy cluster CL J1227. The comparison with lensing data allowed us to estimate the hydrostatic bias. In Paliwal et al. 2025 we classified ACT-CL J0240.0+0116 as disturbed, using morphological indicators derived from its SZ, X-ray, and optical image. In Ferragamo et al. 2022, we have presented a comparison between the hydrostatic and lensing mass profiles of the cluster MACS J0647.7+7015 and found significant variation in the cluster mass estimate depending on the observable, the modeling of the data, and the knowledge of the cluster’s dynamical state.
The final goal of the LPSZ is the study of the full sample that is described in a series of papers (NIKA2 LPSZ results). It includes description of 150 and 260 GHz maps, the characterization of point-source populations in clusters, the measurement of thermodynamic profiles and integrated ICM quantities, the determination of the universal pressure profile, constraints on the SZ–mass scaling relation, an analysis of SZ fluctuations associated with non-thermal processes and a morphological classification of clusters of galaxies.
The LPSZ team
Principal Investigators : F. Mayet and L. Perotto (LPSC Grenoble)
- Rémi ADAM (Nice)
- Nabila AGHANIM (IAS)
- Rafael BARRENA DELGADO (IAC)
- Iacopo BARTALUCCI (Milan)
- Alexandre BEELEN (LAM)
- Boris Bolliet (Cambridge)
- Valentina Capalbo (Rome)
- Damien CHEROUVRIER (LPSC Grenoble)
- Nicolas Clerc (IRAP Toulouse)
- Daniel De Andres (Madrid)
- Marco DE PETRIS (Rome)
- François-Xavier DESERT (IPAG)
- Marian DOUSPIS (IAS)
- Simon Dupourqué (IRAP Toulouse)
- Antonio FERRAGAMO (Rome)
- Corentin Hanser (CPPM)
- Florian Kéruzoré (Argonne)
- Juan MACIAS-PEREZ (LPSC Grenoble)
- Frederic MAYET (LPSC Grenoble)
- Jean-Baptiste MELIN CEA
- Alice MOYER-ANIN (LPSC Grenoble)
- Miren Muñoz ECHEVERRIA (IRAP Toulouse)
- Aishwarya PALIWAL (Rome)
- Elia PAPALARDO (Rome)
- Laurence PEROTTO (LPSC Grenoble)
- Etienne POINTECOUTEAU (IRAP Toulouse)
- Nicolas PONTHIEU (IPAG)
- Gabriel PRATT (CEA)
- Jose Alberto RUBINO MARTIN (IAC)
- Florian RUPPIN (IP2I Lyon)
- Raphael WICKER (Rome)
- Gustavo YEPES (UAM)
Peer reviewed publications - LPSZ sample studies
-
-
- NIKA2 LPSZ Results I. High-angular resolution maps of the galaxy cluster sample of the Sunyaev-Zeldovich NIKA2 Large Program
C. Hanser et al., submitted to A&A - NIKA2 LPSZ Results II. Millimetre Point Source population across clusters of galaxies - Evidence for a gravitational lensing effect
F. X. Désert et al., submitted to A&A - NIKA2 LPSZ Results III. High-resolution SZ-X-ray synergy to obtain the thermodynamic profiles of a sample of high-redshift clusters
C. Hanser et al., submitted to A&A - NIKA2 LPSZ Results IV. Universal Pressure Profile
C. Hanser et al., in preparation - NIKA2 LPSZ Results V. The scaling relation between SZ observables and hydrostatic equilibrium masses
A. Moyer-Anin et al., submitted to A&A - NIKA2 LPSZ Results VI. Turbulence in the intracluster medium as seen through Sunyaev-Zel’dovich fluctuations
R. Adam et al., submitted to A&A - NIKA2 LPSZ Results VII. Clusters dynamical state inference by Zernike polynomials on high-angular resolution tSZ images
E. Papparlado et al., in preparation (NIKA2 editorial board)
- NIKA2 LPSZ Results I. High-angular resolution maps of the galaxy cluster sample of the Sunyaev-Zeldovich NIKA2 Large Program
-
Peer reviewed publications - individual LPSZ cluster studies
-
-
- Exploiting the high-resolution NIKA2 data to study the intracluster medium and dynamical state of ACT-CL J0240.0+0116
A. Paliwal et al., Astron. and Astrophys 698 (2025) A2, ADS link - Multi-probe analysis of the galaxy cluster CL J1226.9+3332: Hydrostatic mass and hydrostatic-to-lensing bias
M. Muñoz-Echeverría et al., Astron. and Astrophys. 671 (2023) A28, ADS link - Exploiting NIKA2 SZ/XMM-Newton imaging synergy for intermediate-mass, high-z galaxy clusters within the NIKA2 SZ Large Program. Observations of ACT-CL J0215.4+0030 at z~0.9
F. Kéruzoré et al., Astron. and Astrophys. 644 (2020) A93, ADS link - First Sunyaev-Zel’dovich mapping with NIKA2: implication of cluster substructures on the pressure profile and mass estimate
F. Ruppin et al., Astron. and Astrophys. 615 (2018) A112, ADS link
- Exploiting the high-resolution NIKA2 data to study the intracluster medium and dynamical state of ACT-CL J0240.0+0116
-
Peer reviewed publications - LPSZ twin sample (the300 and MUSIC)
-
-
- Galaxy cluster temperature maps from joint X-ray and SZ maps with The Three Hundred hydrodynamical simulations
R. Wicker et al., accepted in Astron. and Astrophys., ADS link - Galaxy cluster mass bias from projected maps – The Three Hundred-NIKA2 LPSZ twin samples
M. Muñoz-Echeverría et al., Astron. and Astrophys. 682 (2024) A124, ADS link - Exploring the hydrostatic mass bias in MUSIC clusters: Application to the NIKA2 mock sample
G. Gianfagna et al., Mon. Not. Roy. Astron. Soc. 502 (2021) 5115, ADS link - Impact of ICM disturbances on the mean pressure profile of galaxy clusters: a prospective study of the NIKA2 SZ large program with MUSIC synthetic clusters
F. Ruppin et al., Astron. and Astrophys. 631 (2019) A21, ADS link
- Galaxy cluster temperature maps from joint X-ray and SZ maps with The Three Hundred hydrodynamical simulations
-
Peer reviewed publications - associated studies
-
-
- PANCO2: A python library to measure intracluster medium pressure profiles from Sunyaev-Zeldovich observations
F. Kéruzoré et al., Open Journal of Astrophysics 6 (2023) 9, ADS link - Comparison of hydrostatic and lensing cluster mass estimates: a pilot study in MACS J0647.7+7015
A. Ferragamo et al., Astron. and Astrophys. 661 (2022) A65, ADS link - The hydrostatic-to-lensing mass bias from resolved X-ray and optical-IR data
M. Muñoz-Echeverría et al., Astron. and Astrophys. 682 (2024) A147, ADS link
- PANCO2: A python library to measure intracluster medium pressure profiles from Sunyaev-Zeldovich observations
-
LPSZ Public data release
The NIKA2 LPSZ team is happy to share with the community the data products obtained in the context of this long standing endeavour within the NIKA2 guaranteed time.
The LPSZ public data release consists of several types of data products described in a series of 7 papers (link).
Here is a list of citations that we are requesting whenever you use LPSZ data.
Citations for
- the NIKA2 caméra:
- the LPSZ program:
- Map-related products: C. Hanser et al., LPSZ1 (link)
- Point sources: F.-X. Désert et al., LPSZ2 (link)
- Thermodynamic profiles: C. Hanser et al., LPSZ3 (link)
- LPSZ Universal Pressure Profile: C. Hanser et al., LPSZ4 (link)
- LPSZ Scaling Relation: A. Moyer-Anin et al., LPSZ5 (link)
- LPSZ pressure fluctuation results: R. Adam et al., LPSZ6 (link)
- LPSZ cluster classification (Zernike): E. Pappalardo et al., LPSZ7 (link)
Public release of SZ maps
The public data release consists of flux maps and null-maps at 150 and 260 GHz, as well as the 1D and 2D transfer functions at 150 GHz. They are available on the IRAM webpage. The LPSZ observations were conducted with the NIKA2 camera at the IRAM 30-m telescope from April 2017 until February 2023, covering 28 observation campaigns, under the IRAM project numbers 199-16 and 171-22. Our team was deeply involved in the observation conductions, allowing for a careful monitoring of the data quality, and re-assessment of the scan strategy.
Citation: C. Hanser et al., LPSZ1 (link)
Public release of cluster thermodynamic properties
The cluster sample has been analysed and we provide the community with
-
- A cluster catalog containing integrated quantities (Y500, M500)
- The full set of thermodynamic profiles (pressure, density, temperature, entropy and hydrostatic mass) for the baseline analysis and the direct gNFWf fit.
For convenience, we provide individual files for each LPSC cluster (see table) and a file containing all clusters (to be done later).
To retrieve data, please send an email to L. Perotto & F. Mayet (PIs) to get the password.
Citation: C. Hanser et al., LPSZ3 (link)
| Cluster name | Redshift (z) | RA (J2000) | Dec (J2000) |
Thermodynamic Profiles and MC chains |
Images (all profiles) |
| PSZ2 G045.32-38.46 | 0.594 | 21:29:26.18 | -7:41:28.68 | PSZ2 G045.32-38.46.tar.gz | |
| PSZ2 G046.13+30.72 | 0.569 | 17:17:05.81 | +24:04:25.32 | PSZ2 G046.13+30.72.tar.gz | |
| PSZ2 G080.64+64.31 | 0.502 | 14:27:16.13 | +44:07:30.36 | PSZ2 G080.64+64.31.tar.gz | |
| PSZ1 G080.66-57.87 | 0.705 | 23:27:27.70 | -2:04:37.56 | PSZ1 G080.66-57.87.tar.gz | |
| PSZ2 G081.02+50.57 | 0.501 | 15:39:06.96 | +50:36:46.80 | PSZ2 G081.02+50.57.tar.gz | |
| PSZ2 G084.10+58.72 | 0.731 | 14:49:00.84 | +48:33:24.84 | PSZ2 G084.10+58.72.tar.gz | |
| PSZ2 G085.95+25.23 | 0.782 | 18:30:35.40 | +56:53:40.92 | PSZ2 G085.95+25.23.tar.gz | |
| PSZ2 G086.93+53.18 | 0.771 | 15:14:00.53 | +52:48:12.60 | PSZ2 G086.93+53.18.tar.gz | |
| PSZ2 G087.39+50.92 | 0.748 | 15:26:33.10 | +54:09:08.28 | PSZ2 G087.39+50.92.tar.gz | |
| PSZ2 G091.83+26.11 | 0.816 | 18:31:10.20 | +62:14:34.44 | PSZ2 G091.83+26.11.tar.gz | |
| PSZ2 G094.56+51.03 | 0.539 | 15:08:19.70 | +57:54:59.04 | PSZ2 G094.56+51.03.tar.gz | |
| PSZ2 G099.86+58.45 | 0.615 | 14:14:46.85 | +54:47:02.40 | PSZ2 G099.86+58.45.tar.gz | |
| PSZ2 G104.74+40.42 | 0.835 | 15:46:35.33 | +69:57:42.00 | PSZ2 G104.74+40.42.tar.gz | |
| PSZ2 G108.27+48.66 | 0.673 | 14:27:04.57 | +65:39:46.94 | PSZ2 G108.27+48.66.tar.gz | |
| PSZ2 G111.61-45.71 | 0.546 | 0:18:33.58 | +16:26:10.32 | PSZ2 G111.61-45.71.tar.gz | |
| PSZ2 G126.57+51.61 | 0.816 | 12:29:44.64 | +65:21:21.60 | PSZ2 G126.57+51.61.tar.gz | |
| PSZ2 G133.59+50.68 | 0.529 | 11:46:50.47 | +65:05:10.68 | PSZ2 G133.59+50.68.tar.gz | |
| PSZ2 G141.77+14.19 | 0.821 | 4:41:06.22 | +68:13:12.72 | PSZ2 G141.77+14.19.tar.gz | |
| PSZ2 G144.83+25.11 | 0.584 | 6:47:50.16 | +70:14:53.16 | PSZ2 G144.83+25.11.tar.gz | |
| PSZ2 G155.27-68.42 | 0.567 | 1:37:24.86 | -8:27:20.52 | PSZ2 G155.27-68.42.tar.gz | |
| PSZ2 G160.83+81.66 | 0.888 | 12:26:58.08 | +33:32:46.68 | PSZ2 G160.83+81.66.tar.gz | |
| PSZ2 G183.90+42.99 | 0.559 | 9:10:48.77 | +38:50:08.52 | PSZ2 G183.90+42.99.tar.gz | |
| PSZ2 G201.50-27.31 | 0.538 | 4:54:11.30 | -3:00:58.32 | PSZ2 G201.50-27.31.tar.gz | |
| PSZ2 G211.21+38.66 | 0.505 | 9:11:11.28 | +17:46:33.60 | PSZ2 G211.21+38.66.tar.gz | |
| PSZ2 G212.44+63.19 | 0.542 | 10:52:51.82 | +24:15:30.24 | PSZ2 G212.44+63.19.tar.gz | |
| PSZ1 G226.65+28.43 | 0.724 | 8:56:20.59 | +1:46:49.08 | PSZ1 G226.65+28.43.tar.gz | |
| PLCK G227.99+38.11 | 0.810 | 9:32:21.38 | +5:41:24.00 | PLCK G227.99+38.11.tar.gz | |
| PSZ2 G228.16+75.20 | 0.545 | 11:49:35.42 | +22:24:03.96 | PSZ2 G228.16+75.20.tar.gz | |
| ACT-CL J0022.2-0036 | 0.805 | 0:22:12.31 | -0:36:17.28 | ACT-CL J0022.2-0036.tar.gz | |
| ACT-CL J0119.9+0055 | 0.720 | 1:19:59.30 | +0:55:09.48 | ACT-CL J0119.9+0055.tar.gz | |
| ACT-CL J0215.4+0030 | 0.865 | 2:15:28.37 | +0:30:32.04 | ACT-CL J0215.4+0030.tar.gz | |
| ACT-CL J0223.1-0056 | 0.663 | 2:23:10.08 | -0:57:11.88 | ACT-CL J0223.1-0056.tar.gz | |
| ACT-CL J0240.0+0116 | 0.620 | 2:40:03.38 | +1:15:58.32 | ACT-CL J0240.0+0116.tar.gz |
Public release of LPSZ point sources
Point-source catalog (to be done)
Public release of LPSZ UPP
to be done
Public release of LPSZ SR
to be done
Public release of LPSZ cluster classification (Zernike)
to be done
Contact: F. Mayet and L. Perotto
PhD thesis mainly dedicated to LPSZ
- The SZ-Mass scaling relation of the NIKA2 SZ Large Program : Analysis, systematic effects and applications to cosmology
Alice Moyer-Anin - Univ. Grenoble Alpes - 2025 - Ph. advisor: F. Mayet
Link to thesis
Soon: post-doc Tokyo University / KAVLI Institute - Cosmology with the galaxy clusters of the NIKA2 Sunyaev-Zeldovich Large Programme
Corentin Hanser - Univ. Grenoble Alpes - 2024 - Ph. advisor: L. Perotto
Link to thesis
Currently: post-doc CPPM Marseille - Study of clusters of galaxies by hydrodynamic simulations and observations with cosmological implications
Paliwal Aishwarya - Univ. Sapienza of Rome - 2023 - Ph. advisor: M. De Petris, co-supervisors G. Yepes (Universidad Autonoma de Madrid) and A. Ferragamo (Università Federico II di Napoli)
Link to thesis
Currently: postdoc Univ. di Roma ‘Tor Vergata’ - Multi-wavelength cosmology with clusters of galaxies
Miren Muñoz Echevarría - Univ. Grenoble Alpes - 2023 - Ph. advisor: J. F. Macías-Pérez
Link to thesis
Currently: post-doc IRAM Granada - Cosmology with Sunyaev-Zeldovich observations of galaxy clusters with the NIKA2 camera
Florian Kéruzoré - Univ. Grenoble Alpes - 2021 - Ph. advisor: F. Mayet
Link to thesis
Currently: post-doc Argonne National Lab. (IL, USA) - Cosmology from Sunyaev-Zel’dovich observations of galaxy clusters with the NIKA2
Florian Ruppin - Univ. Grenoble Alpes - 2018 - Ph. advisor: F. Mayet
Link to thesis
Currently: junior professor (cosmology) - University of Lyon (France)
Master's thesis mainly dedicated to LPSZ
- Clusters of galaxies dynamical state inference by Zernike polynomials applied on high resolution tSZ maps
Elia Pappalardo - Univ. Sapienza of Rome - 2024 - Ph. advisor: M. De Petris, co-supervisors A. Ferragamo (Università Federico II di Napoli) and R. Wicker (Sapienza)Link to thesis
Currently:
A pilot study with NIKA
NIKA2 SZ capabilities have been demonstrated through a pilot study conducted with its pathfinder, NIKA, a prototype of NIKA2 that has been operated at the IRAM 30-m telescope from 2012 to 2015. Its field of view was smaller (1.8 arcmin) due to the reduced number of KIDs (356). In order to validate the use of a KID-based camera for SZ science, we have observed six clusters of galaxies and combined SZ data with X- ray data to study their thermodynamical properties.
The NIKA SZ data have been publicly released on 2017 Nov 20th.
Public Release of NIKA SZ Data
The NIKA camera was used to image galaxy clusters using the Sunyaev-Zel'dovich (SZ) effect. A total of six clusters have been observed, providing a pilot project to prepare future NIKA2 observations that are now undergoing at the IRAM 30-m telescope. In particular, wa have combined SZ data with X-ray data to study the thermodynamical properties of these clusters.
This webpage aims at describing the content of the released data products associated with this project. Note that, while NIKA was a dual-band instrument observing simultaneously at 150 and 260 GHz, only the 150 GHz data are released for the time being.
Citations
If you use the NIKA released data in a publication or in a conference, please consider citing at least
- the paper corresponding to the cluster (see table)
- the paper on Performance and calibration of the NIKA camera
Data
The data are freely available
You may get
- the full dataset (6 clusters). Please click here
- data fo each cluster of the NIKA SZ sample
| Cluster | z | R.A. | DEC. | Image | Comments | Data | Main Reference |
| RX J1347.5-1145 | 0.452 | 13.0,47.0,30.575 | -11.0,45.0,10.08 | 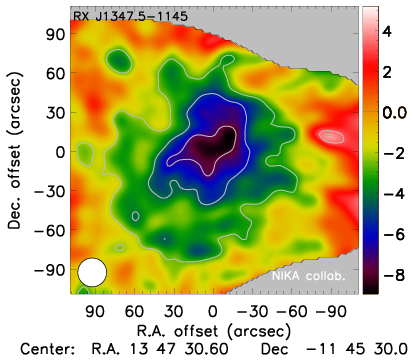 |
Map, point source model, no transfer function and noise realization for this cluster Note that for this cluster, beam and bandpasses are different |
file | R. Adam et al., Astron. and Astrophys. 569 (2014) A66, arXiv:1310.6237 |
| MACS J1423.8+2404 | 0.545 | 14.0,23.0,47.908 | +24.0,04.0,42.6 | 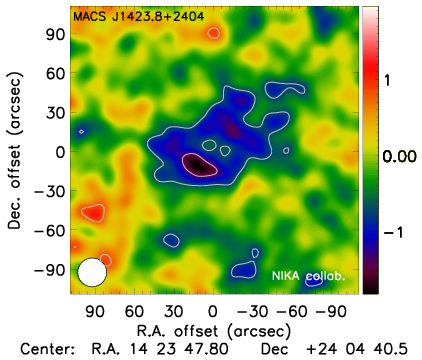 |
Map, noise realization, point source model, transfer function, beam and bandpass |
file | R. Adam et al., Astron. and Astrophys. 586 (2016) A122 arXiv:1510.06674 |
| MACS J0717.5+3745 | 0.546 | 07.0,17.0,31.740 | +37.0,45.0,30.73 | 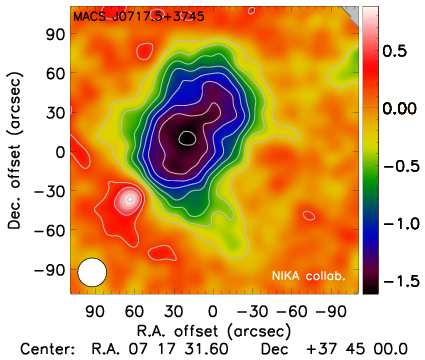 |
Map, kSZ-model-substracted map, noise realization, point source model, transfer function, beam and bandpass |
file | R. Adam et al., Astron. and Astrophys. 598 (2017) A115 arXiv:1606.07721 R. Adam et al., Astron. and Astrophys. 606 (2017) A64 arXiv:1706.10230 |
| PSZ1 G046.13+30.75 | 0.569 | 17.0,17.0,05.780 | +24.0,04.0,26.00 | 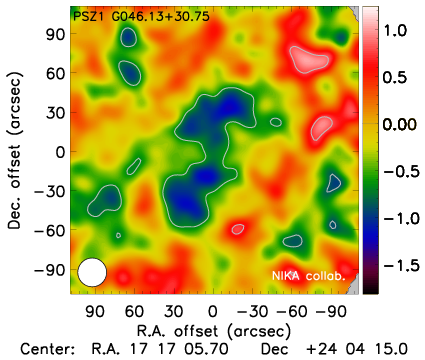 |
Map, noise realization, point source model, transfer function, beam and bandpass |
file | - |
| PSZ1 G045.85+57.71 | 0.611 | 15.0,18.0,20.811 | +29.0,27.0,39.10 | 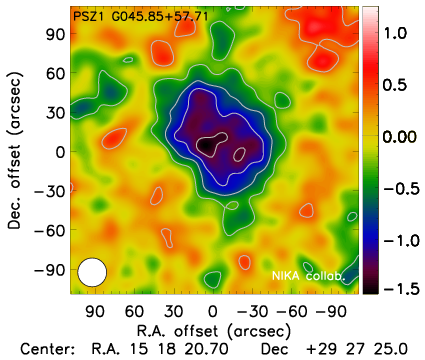 |
map, noise realization, point source model, transfer function, beam and bandpass |
file | F. Ruppin et al., Astron. and Astrophys. 597 (2017) A110 arXiv:1607.07679 |
| CL J1226.9+3332 | 0.888 | 12.0,26.0,58.454 | +33.0,32.0,48.36 | 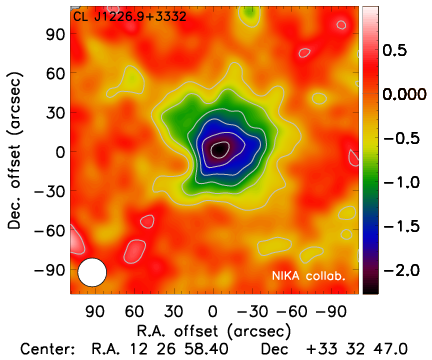 |
map, noise realization, point source model, transfer function, beam and bandpass |
file | R. Adam et al., Astron. and Astrophys. 576 (2015) A12 arXiv:1410.2808 C. Romero et al., arXiv:1707.06113 |
Explanatory supplement
150 GHz Maps
The NIKA maps are computed from raw time ordered data using the NIKA processing pipeline. See Catalano et al (2014), Adam et al (2015) and Adam et al (2014) for the main steps of the data reduction. The maps are given in units of surface brightness (mJy/beam). The data are projected on 151x151 pixels grids, where the size of the pixels are 2x2 arcsec. Images include standard astrometric metadata in the header.
Best-fit Point Source Model
The NIKA cluster fields contain non negligible radio and sub-millimeter sources identified either from NIKA data themselves, from the literature, or from Herschel data. For each cluster, we provide a point source model extracted from jointly fitting NIKA with higher (Herschel) and lower (literature) frequency data. See Adam et al (2016) for the procedure. We stress that the flux of each source in the correction maps are not necessarily well constrained, depending on the available external dataset. In addition, it depends on the underlying model that we assume for the SED of each object (either grey body or power law for infrared and radio sources, respectively). Therefore, we recommend to use this model only to quantify the impact of contaminant galaxies, but not to take it as the true contaminant signal.
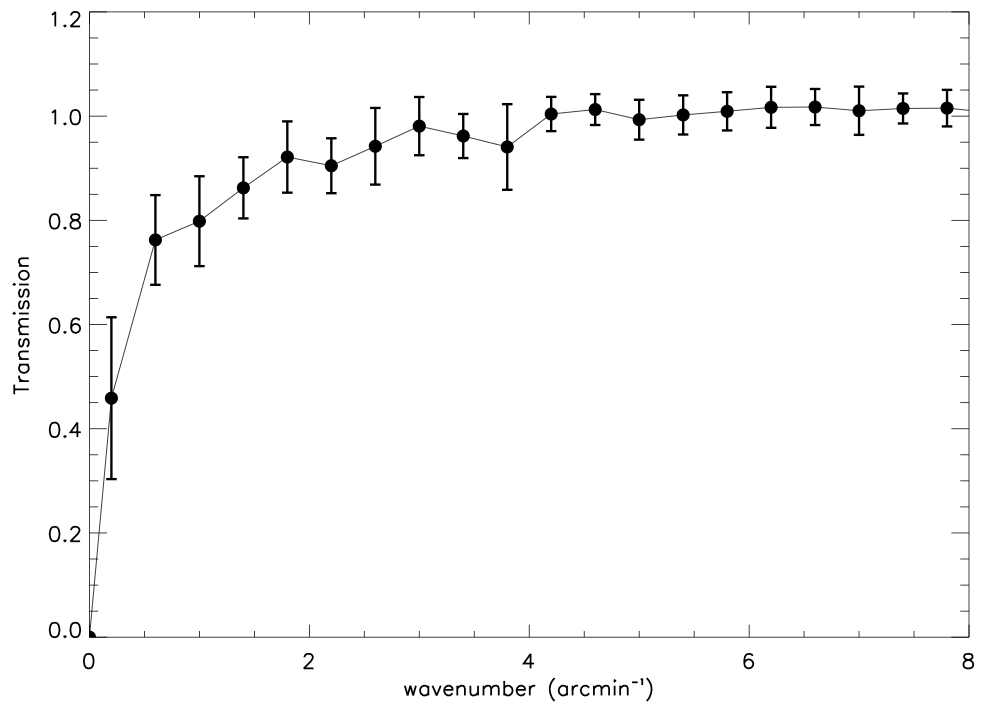
Transfer function
Because of the scanning strategy and the necessary processing to subtract the correlated noise from the time ordered data, the NIKA maps are affected by filtering. This is true in particular for scales beyond the size of the field of view (~2 arcmin). The amount of filtering is estimated as described in Adam et al (2015). In brief, we compare the power spectrum of the map of simulated data before and after processing them through the NIKA pipeline. We provide the azimuthally averaged transfer function, as a function of wave number, for each cluster. We note that NIKA data are not sensitive to the zero level surface brightness of the sky. Therefore, the transfer function at wavenumber k=0 is equal to 0. The error bars provide the dispersion of the transfer function measured on individual scans, and thus, are sensitive to variation of atmospheric conditions during the data acquisition. See figure below for an example of the transfer function. We also provide the following IDL script to be used in order to apply the transfer function to non filtered data, to account for the effects of the reduction. This is to make sure that the definition of the angular frequency, k, is the same when computing and applying the transfer function onto maps. The raw NIKA maps can also be deconvolved in a similar way but the noise (in particular on the edge of the map) will drastically increase.
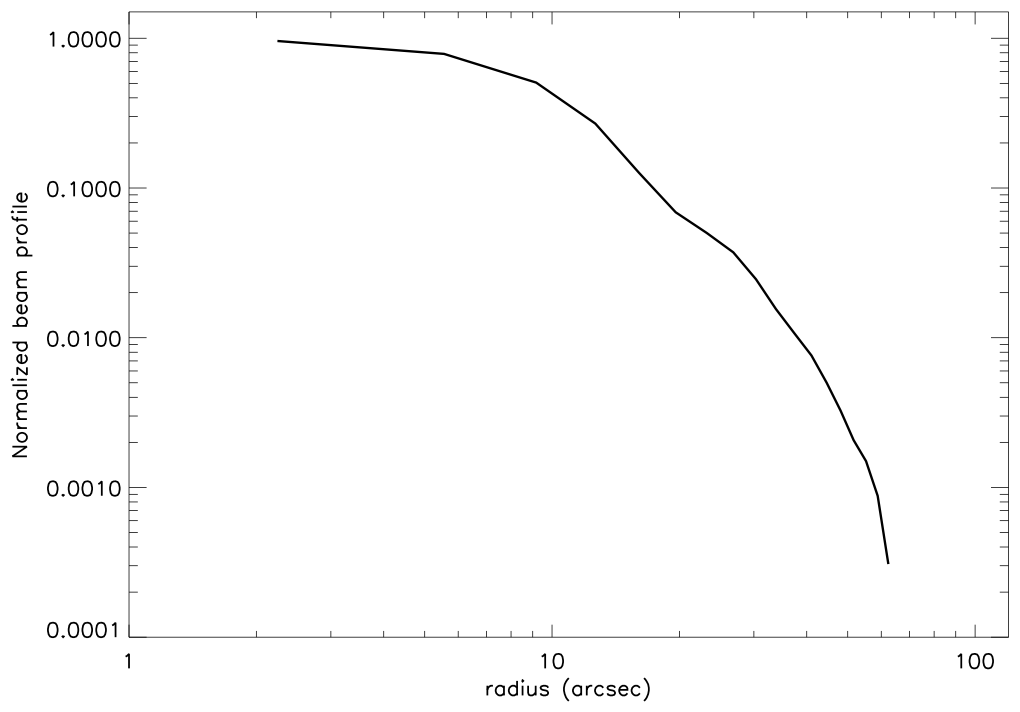
Beam
The beam profile corresponds to the surface brightness profile of Uranus, normalized by the amplitude of the gaussian best fit of the corresponding map (see figure below). The angular size of Uranus is typically about 3.5 arcsec, and it is neglected as it broadens the main beam by only about 0.7%.
 |
 |
 |
| NIKA Transfer function | NIKA Beam | NIKA Bandpass |
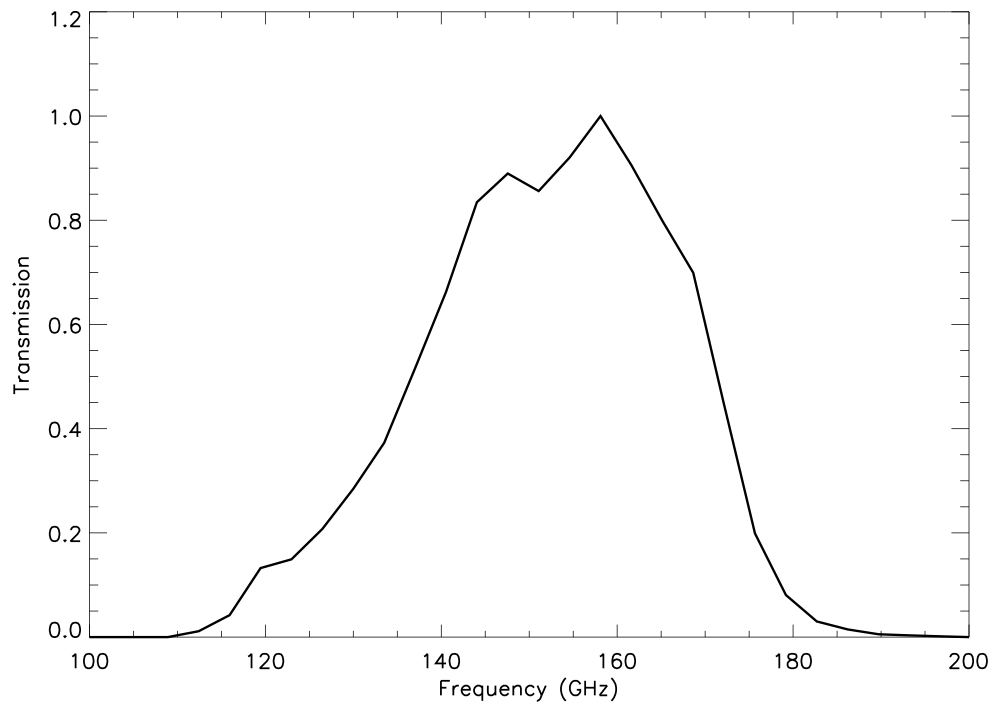
Bandpass and Unit conversion
We provide the NIKA transmission as a function of frequency, obtained in the case of diffuse emission. See Figure above The following tables provide the conversion from Jy/beam to Compton parameter for different gas temperature (see Adam et al (2017) for more details).
| Te (keV) | I0 f(260 GHz) | I0 f(150 GHz) | I0 g(260 GHz) | I0 g(150 GHz) |
| 1 | 3.76 | -11.63 | 7.47 | 12.40 |
| 5 | 3.31 | -11.34 | 7.30 | 12.03 |
| 10 | 2.83 | -11.00 | 7.11 | 11.62 |
| 15 | 2.43 | -10.71 | 6.94 | 11.24 |
| 20 | 2.06 | -10.38 | 6.81 | 10.9 |
| 25 | 1.76 | -10.17 | 6.75 | 10.58 |
We also provide color correction for typical SED, both for extended emission and point sources. The assumed spectra follow f(ν) ∝ να
| α | Point source, pwv=2 mm, 150 GHz |
Point source, pwv=5 mm, 150 GHz |
Diffuse source, pwv=2 mm, 150 GHz |
Diffuse source, pwv=2 mm, 150 GHz |
Point source, pwv=2 mm, 260 GHz |
Point source, pwv=5 mm, 260 GHz |
Diffuse source, pwv=2 mm, 260 GHz |
Diffuse source, pwv=2 mm, 260 GHz |
| -3 | 0.94 | 0.92 | 0.99 | 0.97 | 0.80 | 0.78 | 0.85 | 0.83 |
| -2 | 0.97 | 0.95 | 1.00 | 0.98 | 0.85 | 0.84 | 0.89 | 0.88 |
| -1 | 0.99 | 0.98 | 1.00 | 0.99 | 0.90 | 0.89 | 0.92 | 0.91 |
| 0 | 1.00 | 0.99 | 1.00 | 0.99 | 0.95 | 0.94 | 0.95 | 0.94 |
| 1 | 1.00 | 1.00 | 0.99 | 0.98 | 0.98 | 0.98 | 0.96 | 0.96 |
| 2 | 1.00 | 1.00 | 0.97 | 0.97 | 1.01 | 1.01 | 0.97 | 0.98 |
| 3 | 0.98 | 0.99 | 0.94 | 0.95 | 1.03 | 1.04 | 0.98 | 0.98 |
| 4 | 0.96 | 0.98 | 0.91 | 0.92 | 1.04 | 1.05 | 0.97 | 0.98 |
Noise
For each cluster, we provide a set of 100 noise realizations obtained as described in Adam et al (2016). They include correlated noise as modeled from half difference maps (Jack-Knife), as well as inhomogeneities of the noise due to the scanning strategy. The noise realizations also include the expected contribution from the CIB modeled as described in Adam et al (2017). The latter is largely subdominant for most of the data at 150 GHz, except for the deepest observations of MACS J0717.5+3745 where it becomes significant. The noise contained in the NIKA maps is well described by a gaussian noise, but we stress that it is correlated across pixels of the maps. Therefore, averaging the values of nearby pixels (e.g. when smoothing) does not reduce the noise by sqrt(N).
Special case of RX J1347.5-1145
The NIKA data provided in this page have been obtained with the final NIKA setup, and are homogeneous, except in the case of the cluster RX J1347.5-1145. For this cluster, the detectors, the optics, the bandpasses and the beam were significantly different (see Adam et al (2014)). In addition, the scanning strategy was not optimal due to a mistake in the telescope control system. Therefore, the full characterization of the data was not done for RX J1347.5-1145 and we only provide the raw map in the case of this cluster. We highly encourage to use the data only in a qualitative way (e.g., overlapping contours).
Special case of MACS J0717.5+3745
The cluster MACS J0717.5+3745 is known to host a significant amount of kinetic SZ signal (Mroczkowski et al. 2012, Sayers et al. 2013, Adam et al (2017)). Therefore, we also provide a map corrected from the best fit kSZ model obtained in Adam et al (2017). However, we stress that this models remains poorly constrained and is affected by large degeneracies between the cluster gas line-of-sight velocity and the optical depth. Therefore, in the context of thermal SZ studies, we encourage to use the kSZ corrected map to test the stability of any results, with respect to the kSZ contamination, but not to take the kSZ corrected map as the truth.
pdf version of the explanatory supplement.
Contact : Remi Adam
Last update 5/10/2023